High availability (HA) is the ability of a system to operate continuously without failing for a designated period of time. In information technology, a widely held but difficult-to-achieve standard of availability is known as five-nines availability, which means the system or product is available 99.999% of the time.
Introduction: Once upon a timeline
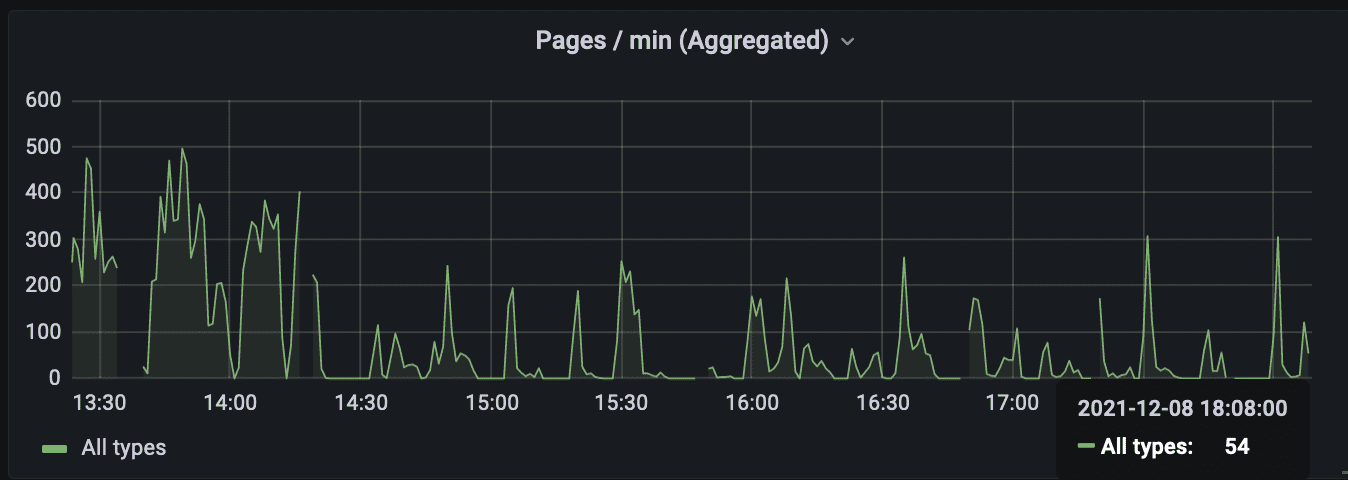
One of the principles of High Availability is Failure Detectability. We use monitoring tools, like Grafana (and Alert tools like PagerDuty), to monitor performance of the system. In doing so, one can occasionally observe a picture like this:
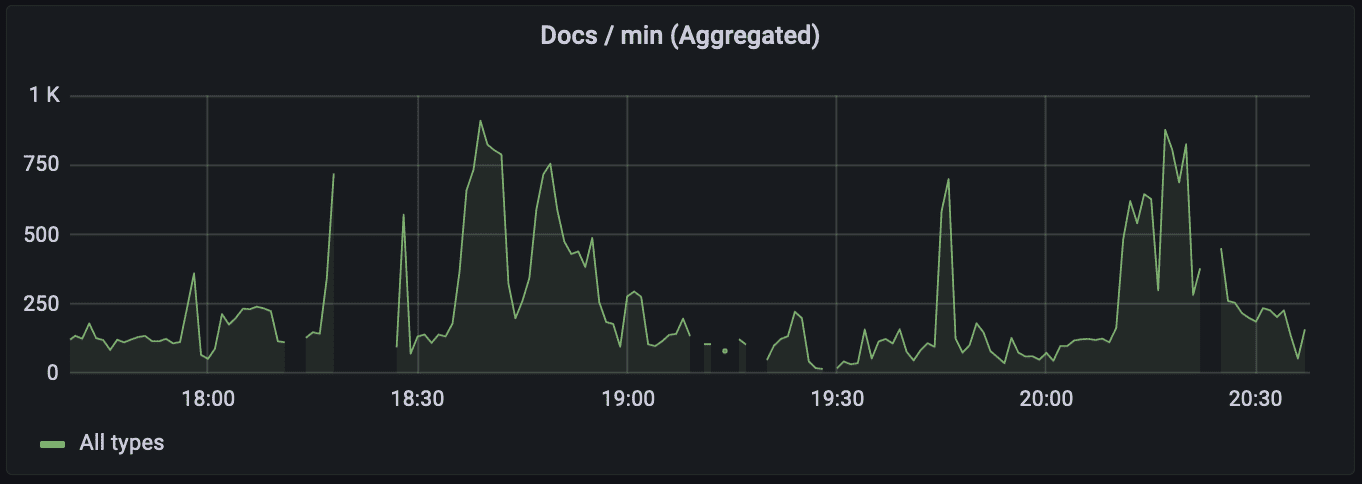
With a sharp eye, one should notice gaps in the graph. These gaps mean that there are periods when the metric plotted on the graph is either not published or not collected (the difference between the two is whether the producer or consumer of the metric is at fault.)
One day, a graph like this left me puzzled and triggered an exciting investigation in an attempt to improve availability of a system under my ownership. The findings were unexpected and revealing. The first three parts are drill-downs into the specific issues, while the last part is an attempt to generalize and draw a conclusion.
Part 1: Know where you Spring from
To begin the investigation, the first thing I had to determine was whether the apparent disruption of the service was due to an application being down, or a metric not published/collected. I took a particular time range where the graph had a gap and collected the application logs for this period:
- 00:30:42.500 [scheduling-1] DEBUG – Publishing metrics
- 00:30:57.503 [scheduling-1] DEBUG – Publishing metrics
- 00:30:57.506 [scheduling-1] INFO – Refreshing CompanyStorage
- 00:32:39.711 [scheduling-1] INFO – Done refreshing CompanyStorage
- 00:32:39.804 [scheduling-1] DEBUG – Publishing metrics
- 00:32:39.806 [scheduling-1] DEBUG – Publishing metrics
These service logs are from a Spring Boot application that accepts and processes requests using worker threads. There is a scheduled task that publishes performance metrics every 15 seconds. There is another scheduled task that performs some heavy operation (refreshing a monstrously big object) and is scheduled every X minutes/hours. The tasks are controlled by Spring’s @Scheduled annotation.
In the log (lines 1 and 2) we see that there were two publishing events separated by 15 seconds. On line 3 we see that a heavy task started. Then there are no other publishing events until the heavy task completes after 102 seconds (line 4). Immediately after that there are two publishing events, one after another, without any delay between them (lines 5 and 6).
A closer look at the log reveals that both tasks, the publishing and the heavy, are executed by the same thread. This means that while scheduling-1 thread is busy running a heavy task, the publishing task is blocked and metrics cannot be published.
It turns out that Spring’s thread pool for scheduled tasks by default has a size of 1. To overcome this problem we can either increase the size of the thread pool by setting spring.task.scheduling.pool.size property, or add @Async annotation to the methods. A good tutorial on using scheduled tasks in Spring can be found here.
Upon this realization I was relieved that my application didn’t suffer from downtime. It was just unable to publish performance metrics from certain periods. The question then becomes: was this a big deal? Actually, it was.
The application’s scaling was based on these metrics, so if the metrics were not published, the scaling event might not happen when needed and this would affect application performance.
Part 2: Environment-friendly recycling
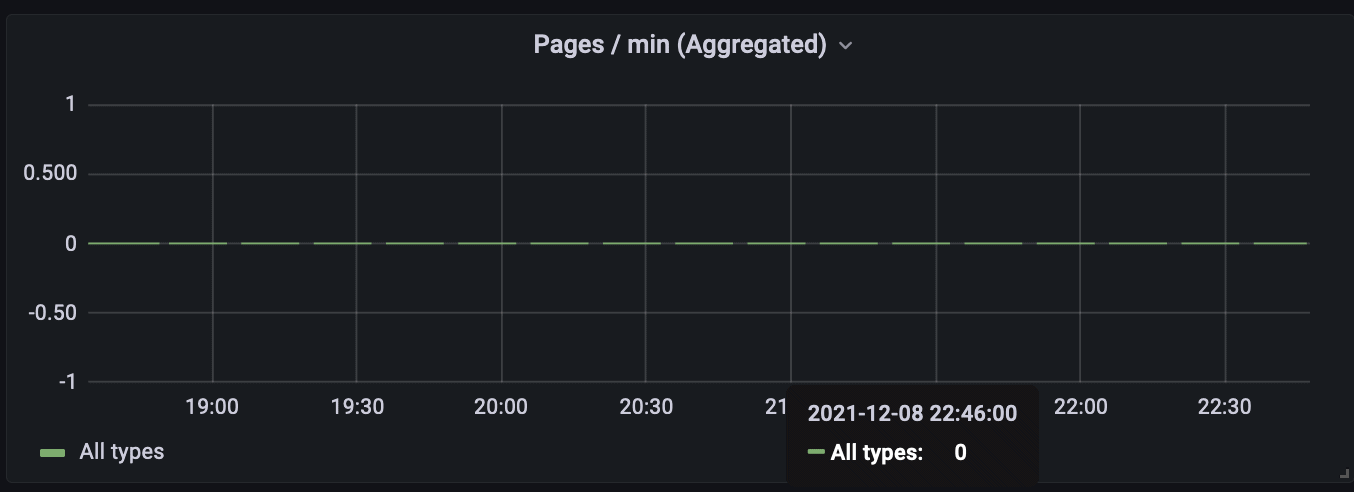
After fixing the scheduled tasks’ thread pool and habitually monitoring the application, I was surprised to notice that the gaps in the graph persisted. While they were somewhat shorter in duration, they were definitely noticeable:
At periods when the value of the metric was zero (no flow of the documents), the graph even looked like a Morse code:
This appeared to be some periodic phenomena. So, I went back to the logs:
- 15:49:00.762 [scheduling-1] DEBUG – Publishing metrics
- 15:49:15.762 [scheduling-1] DEBUG – Publishing metrics
- 15:49:15.762 [scheduling-3] INFO – Refreshing CompanyStorage
- 15:50:03.844 [HikariPool-1 housekeeper] WARN – HikariPool-1 – Thread starvation or clock leap detected (housekeeper)
- 15:50:03.844 [scheduling-1] DEBUG – Publishing metrics
- 15:50:03.845 [scheduling-1] DEBUG – Publishing metrics
- 15:50:03.845 [scheduling-1] DEBUG – Publishing metrics
- 15:50:15.767 [scheduling-1] DEBUG – Publishing metrics
- 15:50:28.195 [scheduling-3] INFO – Done refreshing CompanyStorage
To start, we can see that scheduled tasks are now executed by separate threads and apparently do not interfere with each other. However, publishing tasks are not executed at expected intervals following the invocation of the heavy task. They are executed all at once after some unexplainable delay and a mysterious “Thread starvation or clock leap detected” warning.
So what exactly was happening?
A dreadful thought crossed my mind: garbage collection (oh no!). But before falling into a pit of despair, I decided to enable GC logs and see what would result.
- 00:30:57.503 [scheduling-1] DEBUG – Publishing metrics
- 00:30:57.506 [scheduling-3] INFO – Refreshing CompanyStorage
- 00:31:01.693 [GC (Allocation Failure) [PSYoungGen: …] [Times… real=9.76 secs]
- 00:31:12.502 [scheduling-1] DEBUG – Publishing metrics
- 00:31:24.431 [GC (Allocation Failure) [PSYoungGen: …] [Times… real=2.35 secs]
- 00:31:26.682 [Full GC (Ergonomics) [Times: user=21.45 sys=11.47, real=39.47 secs]
- 00:32:06.155 [HikariPool-1 housekeeper] WARN – HikariPool-1 – Thread starvation or clock leap detected
- 00:32:06.156 [scheduling-1] DEBUG – Publishing metrics
- 00:32:06.170 [scheduling-1] DEBUG – Publishing metrics
- 00:32:06.170 [scheduling-1] DEBUG – Publishing metrics
- 00:32:12.500 [scheduling-1] DEBUG – Publishing metrics
- 00:32:14.935 [GC (Allocation Failure) [PSYoungGen: …] [Times… real=2.79 secs]
- 00:32:27.499 [scheduling-1] DEBUG – Publishing metrics
- 00:32:35.397 [GC (Allocation Failure) [PSYoungGen: …] [Times… real=2.94 secs]
- 00:32:39.711 [scheduling-3] INFO – Done refreshing CompanyStorage
- 00:32:42.504 [scheduling-2] DEBUG – Publishing metrics
There is a series of minor garbage collections that last between 2 to 9 seconds. Not exactly something to be proud of, but not something that should deprive us of sleep at night.
But take a closer look at line 6: there is a Full GC that lasts for 40 seconds.
This is nothing else than the notorious “stop-the-world” garbage collection. Application as a whole is halted and waits for GC to complete its job. This time not only are metrics not published, but all other threads processing incoming requests are put on hold. This is a full-blown downtime of the application. Checking the logs I noticed that some of the Full GCs were taking minutes.
There is an additional nuance: during this pause, the health-check endpoint is also unavailable and depending on the configuration, a sensitive health-check may cause the whole container to terminate, thus extending the downtime even further.
If you are a GC expert or intend to become one, you can tune GC settings to obtain optimal GC pause time. If you don’t have a lot of GC expertise, then I would recommend using the G1 GC algorithm because of its auto-tuning capability
Let’s not pretend and follow the above advice. If you are or intend to become an expert, this site is a fantastic source of information on everything GC-related. As a sidenote: in Java 1.9 G1 GC became a default choice. This is one of the biggest reasons to keep your Java version up to date.
At this point, I updated command line parameters of the application to the following:
-XX:+UseG1GC -XX:MaxGCPauseMillis=200 -XX:ParallelGCThreads=5 -XX:ConcGCThreads=5 -verbose:gc -XX:+PrintGCTimeStamps -XX:+PrintGCDateStamps
The result was successful: no Full GCs and most of the collections consumed less than 200 milliseconds. Finally, uninterrupted execution of the application. Job well done.
Part 3: One thought fills immensity
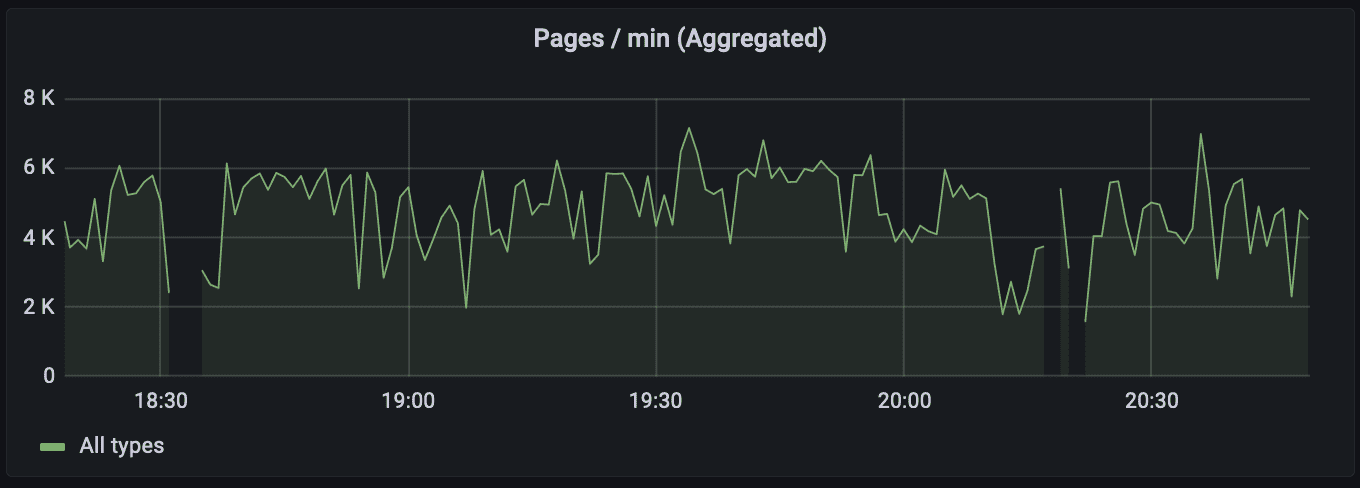
Out of sheer paranoia and suspicion, I continued to monitor the application. I couldn’t believe my eyes.
What was going on this time?
Unfortunately, the logs didn’t reveal much. The log messages ran as usual until all of a sudden the next coming message informed me that the application was starting up. It looked like the application was crashing and restarting, but offered little reason in the logs. And this pattern repeated periodically. Luckily, after a plea to DevOps, it was revealed that the application’s K8 container was killed by OOM Killer.
There are two types of OOMKilled errors in Kubernetes:
- OOMKilled: Limit Overcommit
- OOMKilled: Container Limit Reached
The OOMKilled: Limit Overcommit error can occur when the sum of pod limits is greater than the available memory on the node. While the Limit Overcommit error is related to the total amount of memory on the node, Container Limit Reached is usually relegated to a single pod. When Kuberntetes detects a pod using more memory than the set limit, it will kill the pod with error OOMKilled—Container Limit Reached.
Looking at the memory utilization of the container revealed the following picture:
The blue line was the requested memory while the yellow line was the used memory, or specifically container_memory_working_set_bytes. We can see that memory utilization drops sharply 4 times and the dashboard with container termination reason informs us that it was OOMKilled. See below for an eloquent, though not very intuitive, visualization:
Allow me to to provide some details about deployment of the application: Application’s container requires (and limits to) 8GB of memory of which 7.5GB are allocated to Java heap with -Xmx7500m -Xms7500m command line flags.
The container was killed because memory utilization reached the requested maximum (i.e. Container Limit Reached). But why? Wasn’t our glorious G1 GC doing a good job? I decided to experiment with doubling the memory resources (requested 16GB for the container and allocated 15GB to Java heap). The result was exactly the same, except it took a bit longer to exhaust the available memory. Why was this the case? I was sure it was a memory leak of sorts. Unfortunately, collecting memory dumps on our Kubernetes instances is not a trivial task, as they don’t have standard Java tools like jmap. I ran the application locally and profiled it with jvisualvm.
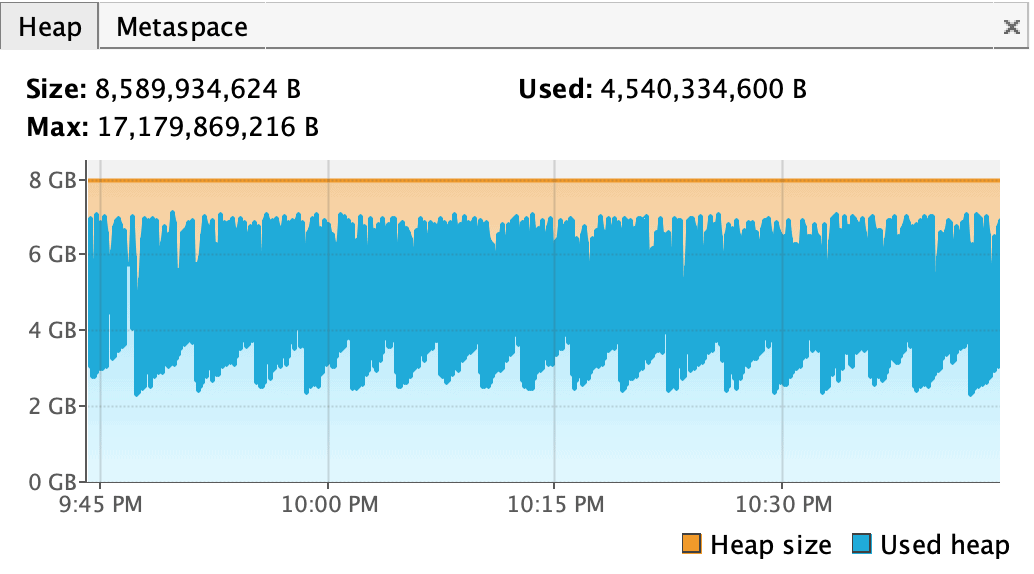
Running it with 8GB heap space produced the following result:
The first obvious thing is that it didn’t fail with OOM error. The second is that there was no upward trend in memory utilization, which proved that there was no memory leak. Lastly, the fact that memory utilization went up and down proved that GC was working fine.
Why didn’t it behave the same way in K8? Both locally and remotely Java was started with the same size of the heap space, specified by -Xmx parameter. However, locally the overall memory of the process was not restricted by any limits except the available physical memory of the local machine. Whereas in K8, it was restricted to the amount requested by the container, i.e. 8GB in the first experiment and 16GB in the second. So, the memory pressure was not due to the lack of heap space, but something else entirely.
This article put everything in place:
What you have specified via the -Xmx switch is limiting the memory consumed by your application’s heap. Besides heap there are other regions in memory which your application is using under the hood – namely permgen and stack sizes. But besides the memory consumed by your application, the JVM itself also needs some elbow room. The need for it derives from several different reasons:
- Garbage collection
- JIT optimization
- Off-heap allocations
- JNI code
- Metaspace
But how will I know how much space overall the process needs? The article goes on:
…there is a significant amount of memory eaten up by the JVM internals. But is there a way to predict how much memory is actually going to be needed? As we have found out via painful experience – it is not possible to predict it with reasonable precision. The JVM overhead can range from anything between just a few percentages to several hundred %. Your best friend is again the good old trial and error. So you need to run your application with loads similar to production environment and measure it.
Through trial and error, I realized I am good with 8GB heap and 10GB overall, i.e. 2GB for non-heap needs. Remember that previously it was OOMKilled when running with 15GB heap and 16GB overall. It was an illusion of sorts that the OOM error was caused by allocating too much memory to the Java heap. In fact, it was improper distribution of memory resources between heap and other needs.
The below screenshot shows the memory usage (and the lack of crashes) once the non-heap memory was provided sufficiently:
Part 4: Never read Soviet newspapers before dinner
One sleepless night, before going to bed, I opened Grafana and… You know the rest.
Now it is time to zoom out and take a look at a broader picture. Programming errors and resources misallocation is only one class of problems affecting availability of the application. There are multiple other reasons why application may experience a real, or apparent disruption of service that goes beyond the reasons pertaining to the application itself:
- Pod re-allocation due to K8s cluster optimization or maintenance
- Metrics collector issues, i.e. Prometheus, being down
- Application being deployed to a Spot instance that is terminated by AWS
- Other services on the instance not behaving cooperatively and causing “OOMKilled: Limit Overcommit” error
- Any other software or hardware failure on the instance
- Electricity outage in the Data Center
- Failure to pay AWS bills on time, etc.
In complex distributed systems it is difficult to guarantee perfect uptime. The goal is to reduce the risk of the system’s downtime. This can be achieved by adding redundancy into the system i.e. running multiple copies of the application in hope that in case of a hostile event one of the copies will be able to maintain the service. Whenever possible we should break a single monolithic instance into multiple smaller independent instances. Although, consuming the same amount of resources in total, we reduce the risk that all instances of the service will experience a downtime simultaneously and increase its resilience to such hostile events. This is what High Availability is about.
To conclude, the system may fail for two types of reasons. The first type are those that are intrinsic to the system and under engineer’s control. They are systematic and repeatable. Do your best to fix them or they will haunt you forever. The second type are those that are extrinsic to the system and out of the control. They are sporadic and unpredictable. Use redundancy to limit their impact and improve your system’s HA.
Final recommendation: don’t open Grafana dashboards before going to bed. You risk disrupting your well-deserved rest. There is no redundancy in your health.
Resources
Running Scheduled Jobs in Spring Boot
Stackoverflow: Thread starvation or clock leap detected
Verbose Garbage Collection in Java
OOMKilled: Troubleshooting Kubernetes Memory Requests and Limits
Different Ways to Capture Java Heap Dumps
Why does my Java process consume more memory than Xmx?
The Marriage of Heaven and Hell

