State of Market Intelligence
Read the report
The nature of investment research has radically evolved in recent years.
Once a practice reserved for firms, analysts, and fund managers with the right expertise, modern technology has made investment research accessible to anyone with an interest. From the largest firms on Wall Street to Fortune 500 companies, stock and investment research tools are powering smart decisions based on AI-driven insights.
With the emergence of artificial intelligence in investment research, traditional research methods are no longer sufficient.
The emergence of Big Data—large, hard-to-manage volumes of data that businesses must deal with day to day—has made it impossible to uncover the insights that matter without the support of automation and artificial intelligence. The speed at which the investment world operates today now requires investors to have access to real-time updates and relevant insights about the companies and industries that matter to them.
Further, sophisticated analysis tools and smart data visualizations are essential to building and communicating investment strategies to stakeholders.
In short: whether you’re developing an investment strategy or delivering one to clients, you need to be equipped with the right investment tool to succeed.
All the tools and platforms covered in this guide are designed to support your investment research needs by providing data and news on various asset classes—stocks, mutual funds, exchange-traded funds (ETFs), stock options and more.
This guide will cover our top picks for the best investment research tools currently on the market, including who they’re built for, their top features, and pricing options — all the information you need to decide which tool is best for you.
What features and functionality matter most in a stock and investment research tool?
The best stock and investment research tools power more agile, informed investment strategies. They level up your ability to capitalize on opportunities ahead of your competitors, delivering insights from the investment world’s top sources of data and supported by the newest technologies, such as AI-powered search and automated monitoring.
Before we dive into specific tools on the market, let’s take a deeper look at 5 features and functionalities to look for in a quality stock and investment research tool in 2024:
Access to Premium Content
Even the most savvy research analysts have limitations to what they are able to access through traditional search channels — sources like company websites, search engines, public reports, and stock analysis websites only tell part of the story. Organizations carefully curate what they share to craft public opinion, keeping much of the most important information private.
In addition, broker research — an invaluable source of industry insight — is often hidden behind paywalls, requiring companies to maintain multiple separate subscriptions.
The industry’s best stock research websites and tools provide access to exclusive content sources in one streamlined, centralized platform.
Semantic Search
Perhaps the most powerful application of AI in stock and investment research tools is semantic search — the ability to deliver not only search results that match your exact keywords, but also those that match your intent.
AlphaSense is one of the only investment research tools that provides this capability through our proprietary Smart Synonyms™ technology, which delivers results for your exact search terms and synonyms of your search terms, all while screening out incorrect results for words with multiple meanings.
For example: a search for “ESG investing” on the AlphaSense platform would include results for similar relevant terms, like “socially responsible investing” and “impact investing.”
Rather than have to perform multiple searches with different terms to capture all the information you need, tools with smart search capabilities understand your intent and deliver it to you in a single search.
Real-Time Alerts and Monitoring
The investment world, like the market, moves faster now than any other time in the past. The technology-driven speed of business and the sheer volume of data available today have made it critical for investors to be informed on market trends, company updates, and other real-time data and news.
The catch: this task is virtually impossible to do manually.
Stock and investment research platforms automate the process in ways that save you vast amounts of time and combat the fear of missing out on an important insight.
Real-time alerts provide automated, immediate updates for the stocks, companies, products, industries, or themes you care about most. The best investment tools give users complete control over the frequency and method of delivery of their alerts.
Watchlists and customized dashboards centralize alerts and information about a set of stocks, companies, or industries in one place. They allow users to see a single snapshot of the current most important insights for their investment research.
Sentiment Analysis
Broker research, annual reports, and call transcripts are often dozens of pages long. It takes hours to read through them manually, let alone garner the overall tone behind the discussion it includes.
Enter: sentiment analysis.
Powered by natural language processing (NLP) technology, sentiment analysis not only delivers the right results for your search, but tells you how the market feels about the company, product, trend, or event you’re researching. Investment research tools do this in varying ways.
AlphaSense, for example, uses color-coded analysis to make sentiment clear to the user. The platform also calculates an algorithmic sentiment score that indicates the positive and negative tone of a document and/or the overall set of search results, as well as how it’s changed over time.
Generative AI
Generative AI (genAI) took the world by storm in recent years, bringing rapid transformation and evolution to a range of industries and workflows. In the realm of investment research, generative AI brings profound possibilities—it streamlines the research process by reducing the time spent on routine manual tasks and enhancing the depth and accuracy of analyses.
That’s why more and more investors are choosing to use genAI-powered tools like AlphaSense to enhance and accelerate their research. However, it’s important that the genAI model being used is trained specifically on financial and business data, has guardrails against hallucination, and generates citable data for easy reference and greater security.
AlphaSense’s industry-leading suite of generative AI tools is purpose-built to deliver business-grade insights, leaning on 10+ years of AI tech development. This includes our retrieval-augmented generation (RAG) approach and our proprietary AlphaSense Large Language Model (ASLLM)—trained specifically on business and financial data—which matches or beats the leading third-party LLMs over 90% of the time.
Easy Data Export Capabilities
The information you access with any stock and investment tool is most valuable when you can export it and integrate it into your existing workstream. Further, data extraction makes it possible to transpose information and use it for financial modeling.
Top platforms (like AlphaSense) offer this capability, allowing you to easily export findings to places like Excel so you can analyze with your own formulas or build charts and other visuals. With AI surfacing insights in mere seconds, your reports, decks, and memos can practically write themselves.
Here are the top 10 stock research tools to support your 2024 investing strategies:
AlphaSense
Best for: Executing a holistic stock and investment research strategy
AlphaSense is designed for comprehensive qualitative and quantitative investment research. It’s used by the world’s most respected corporations and financial institutions — including 88% of the S&P 500 and 80% of top asset management firms — and is built for organizations looking to implement a full-scale strategy. It was also recently named one of Forbes’ top 50 AI companies.
What are its features and capabilities?
Leading Content Sources
AlphaSense provides access to 10,000+ premium sources of information, including trade journals, news, SEC filings, and company filings.
Moreover, AlphaSense offers access to two highly valuable proprietary and premium content offerings:
- Expert Transcript Library – Tens of thousands of transcripts of one-on-one calls with industry experts, customers, professionals, competitors, and former and current executives, available as an add-on to the AlphaSense package.
- Wall Street Insights® – A collection of equity research from Wall Street’s leading firms, covering global sector themes, industries, and companies from 1,000+ sell-side and independent firms, available within the AlphaSense platform. Research professionals can even preview the contents of a broker report, saving them wasted time and money on potentially fruitless research.
Pioneering AI and Automation Technology
Unlike other consumer-grade generative AI (genAI) tools trained on publicly available data, AlphaSense takes an entirely different approach. Our industry-leading suite of generative AI tools is purpose-built to deliver business-grade insights and leans on 10+ years of AI tech development. Our proprietary AlphaSense Large Language Model (ASLLM)—trained specifically on business and financial data—matches or beats the leading third-party LLMs over 90% of the time.
Our suite of genAI tools and automation features currently includes:
- Smart Summaries – this feature allows you to glean instant earnings insights—reducing time spent on research during earnings season, quickly capture company outlook, and generate an expert-approved SWOT analysis straight from former competitors, partners, and employees
- Smart Synonyms™ technology is an AI-based feature exclusive to AlphaSense, which recognizes the user intent behind every search and delivers results for both the exact search terms and related keywords.This technology recognizes when results are not relevant to the search intent and automatically filters them out, removing unnecessary noise and eliminating hours wasted on combing through potentially fruitless sources
- Enterprise Intelligence – a first-of-its-kind offering that delivers AlphaSense’s AI-powered search and summarization capabilities to customers’ internal organizational knowledge
- Generative Search – a generative AI chat experience that transforms how users can extract insights from hundreds of millions of premium content sources
- Sentiment Analysis – a feature built with natural language processing (NLP) that identifies changes in a text’s tone and subjective meaning and assigns a numerical sentiment score to help you assess if the document has positive, negative, or neutral sentiments
- Automated Monitoring – customizable real-time alerts that deliver automated updates on any emerging trends, news, topics, markets, and companies you most care about
- Instant Company Insights – provide updates on companies currently on your radar in the form of tearsheets and search analytics, giving you an in-depth reach across document types, industries, and regions
Integration with Tegus
As of July 2024, AlphaSense and Tegus have joined forces, bringing unparalleled access to even more insights, and covering more industries and companies than ever before.
Both platforms come with extensive libraries of high-quality research, as well as data and AI tools that allow users to extract the most value from the insights they find.
Tegus has an extensive and fast-growing library of high-quality expert research, which includes coverage of 35,000+ public and private companies across TMT, consumer goods, energy, and life sciences sectors. Additionally, Tegus’ financial data offering, which includes financials, KPIs, and fully drivable models on more than 4,000 public companies, as well as its BamSEC self-serve solution to search and access securities filings, adds new and unique offerings to AlphaSense’s extensive product suite and datasets.
Uniquely Tailored Experiences
AlphaSense allows users to design their own experience with customizable features throughout the platform — saved search, document notes, custom watchlists and alerts, and curated dashboards all contribute to a unique user interface that delivers the right insights on the right topics, all in real time.
Optimized Convenience Features
The AlphaSense user experience is enhanced with convenience features like easy data export and mobile app access.
How much does it cost?
AlphaSense offers a free two-week trial for all potential users. Subscriptions can be seat-based (for small- and medium-sized companies) or custom (enterprise subscription packages). See our pricing page for more information.
YCharts
Best for: Building compelling visuals
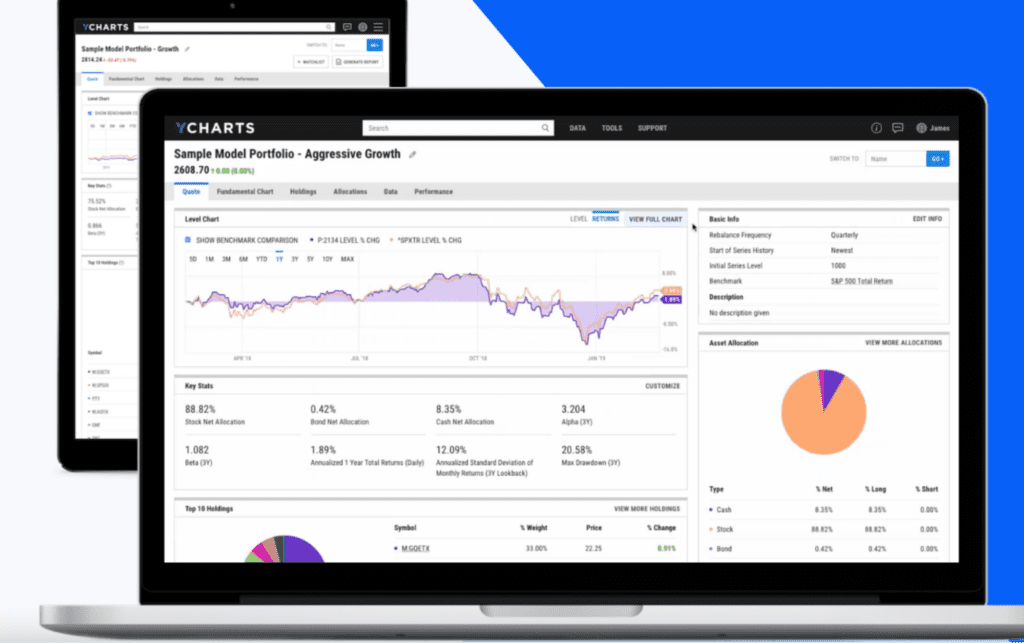
YCharts was built to democratize stock and investment research for asset managers, financial advisors, and individual investors. This tool is exceptionally useful for those who are visual researchers and/or whose roles require development of data visualizations for stock reporting.
What are its features and capabilities?
Model Portfolios
Users can build and analyze portfolios using metrics visualizations, custom strategy comparison reports, and benchmark modeling. Pre-built customizable templates are also available and can fit with any model you create.
Stock Screeners
YCharts features 4000+ financial metrics users can filter to find stocks based on custom criteria and build custom analysis formulas.
Strategy comparison and benchmarking
YCharts allows you to create branded, custom reports that compare your modeling strategy to a prospect’s current portfolio. You can also benchmark modeling around your priority metrics to drive performance improvement and gain a holistic view of your strategy.
Fundamental Charts
YCharts offers charting tools that enable easy sharing of data visualizations, including the ability to embed them as images in other content (like blogs or emails).
How much does it cost?
YCharts offers a free 7-day trial for all potential users and three leveled subscription plans:
- Standard: Best for students, individual investors, financial consultants, and educators
- Professional: Best for individual advisors, portfolio managers, and advanced individual investors
- Enterprise: Best for firms, advising teams, and investment committees
Company-specific pricing for each plan is available upon request to the YCharts team.
Bloomberg Terminal
Best for: Real-time financial data and market analytics, with in-depth industry reports
Bloomberg Terminal is one of the oldest and most widely used investment research tools in the financial services industry. Launched in 1981—well before individual computers or the internet were common at firms—Bloomberg led the way in democratizing access to financial market data.
Since then, Bloomberg has become one of the highest-rated market research tools giving users access to unique market data, news, and insights, enabling professionals to turn intelligence into a competitive advantage.
However, as a legacy solution, Bloomberg has struggled in recent years to keep up with modern research needs. Though they have traditionally been slow to adopt new technologies such as AI, it’s become increasingly apparent that competition is fierce, fast-moving, and highly adept with technology. In order to stay competitive, Bloomberg has slowly adopted genAI capabilities, though their lack of experience in the space is clear. Compared to competitors with years of experience developing an AI tech stack, Bloomberg struggles with clunky UI, limited functionality, and an over-reliance on third-party tech.
Related Reading: Bloomberg Terminal Alternatives
What are its features and capabilities?
Real-Time Data
Bloomberg Terminal offers access to real-time financial market data, stock prices, bonds, commodities, currencies, and derivatives. They also offer real-time news coverage of companies, industries, and markets worldwide, along with real-time alerts on significant market events. Finally, Bloomberg provides access to equity research reports from leading analysts, a highly valuable content set that most competitors cannot offer.
Analytics and Modeling Tools
Bloomberg Terminal offers advanced charting, financial modeling, and analytics for equities, fixed income, and commodities. There are also risk analytics, asset allocation, and portfolio optimization tools available for asset managers and financial professionals.
Trading Platform
Bloomberg offers a complete trading solution, bringing together pricing, analytics, liquidity, automation, and execution in one place.
Generative AI
Bloomberg recently made its foray into generative AI with its BloombergGPT large language model (LLM), which is purpose-built for finance and is trained on a vast range of financial data. Their model is safeguarded against hallucination since all genAI responses must be grounded in Bloomberg content. However, it is not clear how the LLM interprets and handles queries.
How much does it cost?
Bloomberg Terminal is one of the higher-priced options in the market, with subscription fees at around $24-27K annually per user. Bloomberg also bundles multiple services into its product, making it clunky and complex for the average user. For more information and specific pricing, please contact Bloomberg directly.
Gurufocus
Best for: Value investing
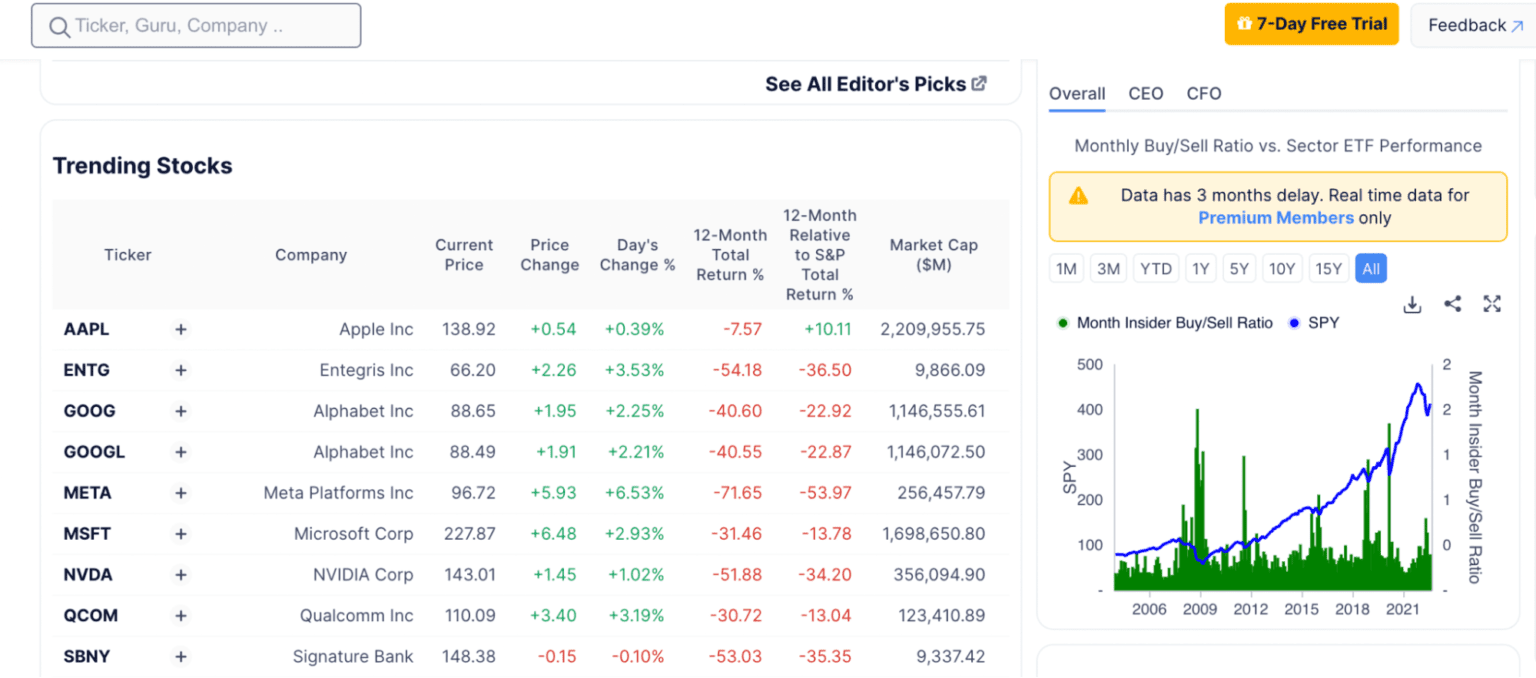
GuruFocus was created for institutional investors as a source for finding high-potential stocks that have already been researched by the world’s top investors. Today, it’s one of the industry’s top value investing websites, providing stock financials, valuation data, and proprietary stock screening and backtesting tools that help investors make informed decisions.
It’s best for value investors who want to find and follow already-identified high potential stocks, then stick with them for a while.
What are its features and capabilities?
Stock Screening Tools
GuruFocus offers advanced stock screeners that allow users to filter stocks based on a variety of criteria, such as valuation ratios, financial metrics, and other investment parameters. These screeners help users identify potential investments that align with their strategies.
Guru Portfolios
One of the most unique features is the “Guru Portfolios,” where users can track the holdings and investment strategies of prominent hedge fund managers and investors like Warren Buffett, Charlie Munger, and others. This insight into “guru” investments can help inform decision-making.
Stock Assessment Tools
GuruFocus provides various valuation tools, including discounted cash flow (DCF) calculators and the Graham Number calculator. These models help investors assess whether a stock is fairly valued or overpriced, making it easier to make buy or sell decisions. The platform also provides warning signs for potential red flags in a company’s financial health, such as deteriorating margins or excessive debt.
Financial Data and Ratios
The platform offers detailed financial data and analysis on stocks, including balance sheets, income statements, cash flow, and financial ratios (e.g., ROE, P/E, and PEG ratios). This allows investors to perform deep fundamental analysis of individual companies.
Custom Alerts
GuruFocus allows users to set up custom alerts for stock price changes, valuation metrics, or insider trading activities. These alerts ensure users don’t miss important changes in their tracked stocks or portfolios.
How much does it cost?
GuruFocus offers a free 7-day trial for potential users. Beyond that, there are three available subscription models:
Premium: $499/year – This level includes most features but with some limitations. For example, trading strategies can only be tested using historical data from the last five years and API queries are limited to 2000. For the individual investor looking to use GuruFocus for daily research, this level should provide everything you need.
Premium Plus: $1348/year -Premium Plus membership offers all GuruFocus key features without the above mentioned limitations (or much higher ceilings). For financial advisors and asset managers at boutique firms, this level is likely most appropriate.
Professional: $2398/year – For larger firms implementing an ongoing research strategy to drive stock investment decisions, this option is likely your best bet. API usage jumps to 50,000 queries under the Professional Membership, you’ll get access to delisted stocks, and GuruFocus will assign you a designated account manager to help you maximize ROI.
Finbox
Best for: Individual investors looking for a laid-back investment strategy
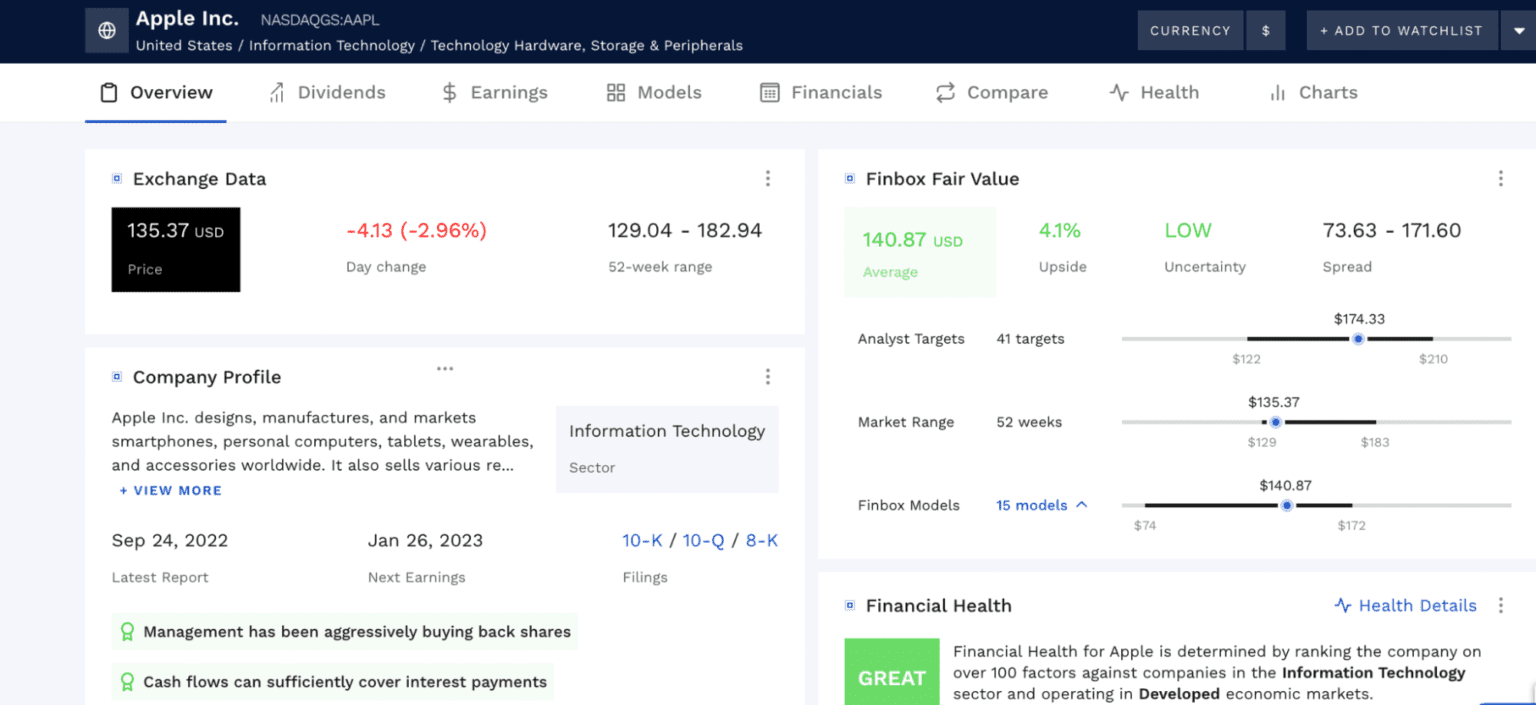
Finbox is similar to GuruFocus, only built more specifically for the individual investor. Serving as a stock market portfolio research and management platform, it offers accurate real-time stocks and market data without many of the premium features and larger research capabilities that come with other tools on this list.
If you’re new to investing or are looking to execute a smart but more laid-back investment strategy, Finbox is a great tool to check out. If you are looking for more sophisticated reporting and access to data outside of stock valuations and market activity, Finbox won’t be enough for you. Additionally, Finbox is not a tool suitable for enterprise organizations.
What are its features and capabilities?
Stock Screening
Finbox offers a highly customizable stock screener with over 1,000 metrics, allowing users to filter stocks based on a wide range of financial and valuation criteria. This helps investors identify investment opportunities based on their specific strategies.
Valuation Models
Finbox provides a variety of built-in valuation models, such as discounted cash flow (DCF), dividend discount models (DDM), and comparable analysis. These models allow users to easily calculate a stock’s intrinsic value and assess its potential upside or downside.
Custom Financial Models
Users can create custom financial models to project future performance based on specific assumptions. The platform provides templates for building models, but also allows full customization for advanced users who prefer to input their own data and formulas.
Key Financial Metrics and Ratios
The platform provides detailed financial data on over 100,000 stocks globally, including key metrics such as price-to-earnings (P/E) ratios, EBITDA, debt ratios, and profitability metrics. This makes it easy to compare and analyze companies at a glance.
Custom Watchlists
The platform enables users to create watchlists of stocks they are interested in and track key performance metrics in real-time. Custom alerts can also be set up to notify users of significant changes in stock prices or financial ratios.
How much does it cost?
Finbox offers a starter version of the tool for $10/month ($120/year) that allows you to view and edit financial models, create charts, and explore potential portfolios.
For $25/month ($300/year), you’ll gain additional features like premium metrics and screener filters and the ability to export data.
For $66/month ($792/year) you’ll unlock data for all six global regions (vs U.S. and Europe only), as well as unlimited filters, metrics, and graphs.
Koyfin
Best for: Basic quantitative research on a budget
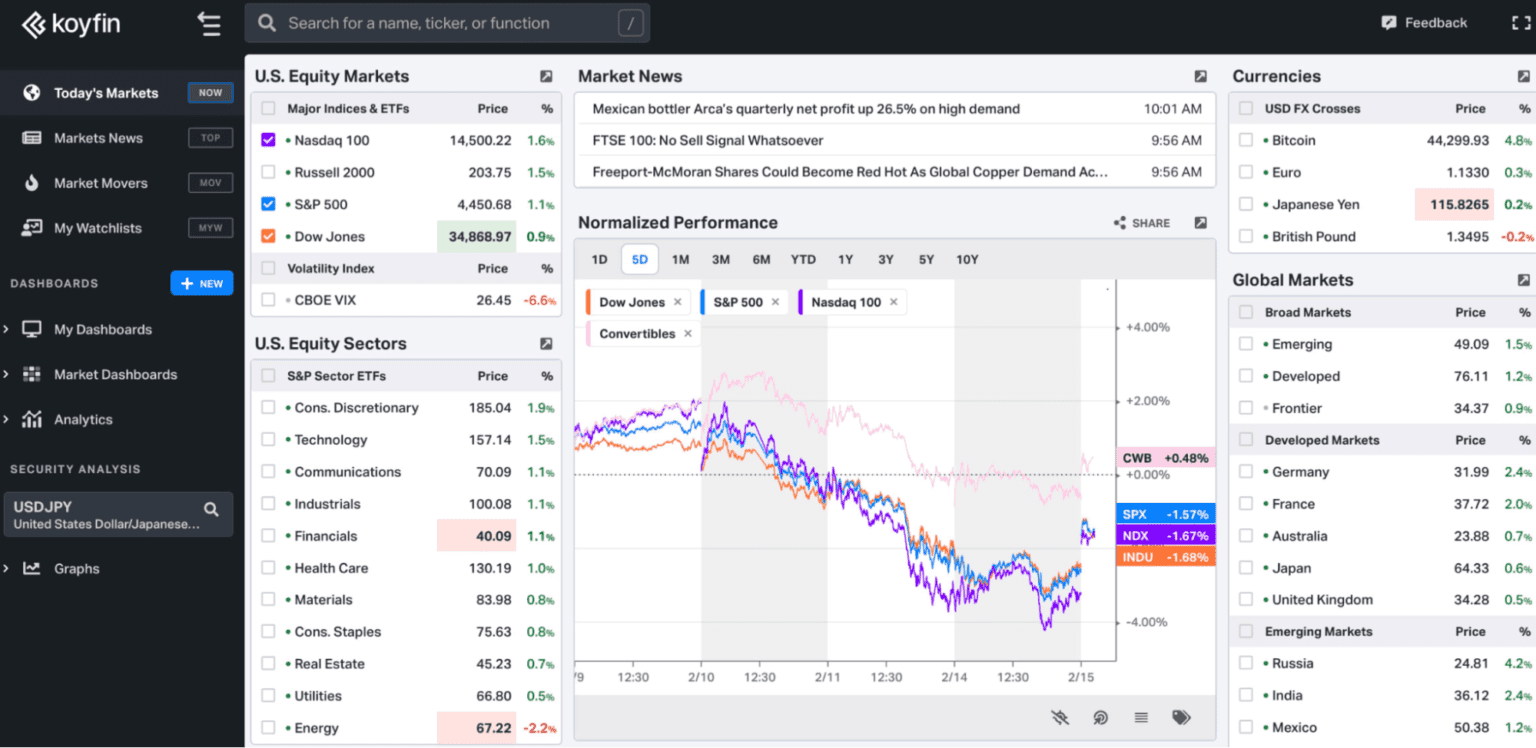
Koyfin is a solution built for investors at every experience level—professional, individual, and student. Known for its user-friendly features and in-depth qualitative data, the Koyfin platform is a great budget alternative to Bloomberg Terminal. While the qualitative research access is relatively basic, the platform makes investing more accessible without sacrificing the sophistication and accuracy needed by firms managing real client portfolios.
Related Reading: Koyfin vs Bloomberg
What are its features and capabilities?
Advanced Charting and Visualization
Koyfin offers powerful charting tools to visualize stock performance, sector trends, and economic data. Users can create custom charts, track performance over various timeframes, and compare different financial instruments (stocks, ETFs, indices, etc.). The charting interface allows multiple metrics to be plotted on a single chart for in-depth analysis.
Stock and ETF Research
The platform provides detailed research tools for stocks and ETFs, offering key financial metrics, valuation ratios, historical performance, and peer comparisons. Users can easily analyze balance sheets, income statements, and cash flow data to assess company fundamentals. The platform also includes a rich library of global macroeconomic data, enabling users to analyze trends such as GDP growth, inflation, interest rates, and employment figures.
Market Dashboards
Koyfin’s customizable dashboards allow users to monitor markets in real-time. These dashboards cover a wide range of asset classes, including equities, fixed income, commodities, and currencies. Users can track news, price movements, and economic indicators relevant to their portfolios.
How much does it cost?
Free – This option is for beginner investors and includes the most important Koyfin features in limited fashion — two watchlists, two dashboards, and two chart templates as well as advanced charting and market dashboards.
Plus: $39/month – This is likely the starting level of experienced investors looking to actively manage their portfolios and perform frequent research. Watchlists, dashboards, and templates are unlimited with a plus membership. Users can also export data, access filings and transcripts, and take advantage of advanced sharing capabilities.
Pro: $79/month – This plan includes everything in the Plus plan as well as custom financial analysis templates, document search capabilities, market closing email summaries, and priority support from the Koyfin team.
Advisor Pro: $179/month – This package includes everything in the Pro plan, but is geared toward financial advisors, so it comes with additional features like client proposal PDFs and portfolio and fund PDFs.
Stockopedia
Best for: Optimizing your portfolio
Stockopedia was founded for individual investors to help them avoid emotional investing in favor of a rules-based approach. Its features are exceptionally helpful for taking a continuous improvement approach to driving portfolio growth over time.
What are its features and capabilities?
How much does it cost?
Stockopedia’s unique pricing model is built on access to regional data. For U.S. data alone, a subscription costs $45/month or $395/year. This subscription covers 10,000+ StockReports with StockRanks.
For U.S. and Canada data together, the subscription costs $65/month or $600/year and includes 12,500+ StockReports with StockRanks.
From there, you can choose to further customize your subscription by adding in different regions, which vary in cost. For more details, see the Stockopedia pricing page.
Stockopedia also offers a 14-day free trial for users to try out the platform.
Business Quant
Best for: Individual investors starting their investing journey
Business Quant was founded to educate individual investors focused on U.S-based stocks and help them make smarter investment decisions. It’s best for investors who want to skip the research hours and get straight to investing—and if you’re a beginner, you’ll appreciate their straightforward messaging and user-friendly interface to make the process approachable.
What are its features and capabilities?
Financial Data Coverage
Business Quant provides detailed financial statements, including income statements, balance sheets, and cash flow statements for publicly traded companies. The platform also provides historical data for financial metrics, helping analysts to track long-term performance and trends across industries.
Customizable Dashboards
Users can build customized dashboards with charts, graphs, and tables to monitor and analyze financial metrics in real-time. Data and charts can also be exported for use in presentations or further analysis.
Pre-Built Financial Models
The platform provides pre-built models such as DCF (Discounted Cash Flow) and comparative valuation models to assist users in analyzing companies. Users can adjust inputs in these models to create custom scenarios and forecasts.
Screeners and Filters
The platform enables users to filter companies based on various metrics such as P/E ratios, growth rates, and margins. Users can also screen companies based on business segments or geographical data for more targeted analysis
How much does it cost?
Business quant offers three straightforward pricing levels:
- Basic: Free and includes access to basic platform data
- Pro: For $19/month, includes granular KPI data, stock research tools, and industry data
- Enterprise: For $99/month, includes Pro plan plus custom-built features to help you reach investing goals
The Motley Fool
Best For: Enthusiastic individual investors looking to learn the ropes
The Motley Fool aims “to make the world smarter, happier, and richer.” They do it not only with their investment research tools but with an active and relatable podcast, blog, discussion board, and other resources for enthusiastic investors (new and experienced alike) looking to level up their investing skills and gain new knowledge.
What are its features and capabilities?
Market Insights
The Motley Fool provides detailed analysis and reports on a wide range of companies and industries, helping investors understand market trends and business. They also offer real-time access to market data, news, and trends to help investors make informed decisions. Finally, Motley Fool analysts provide regular updates on current market conditions and investment opportunities.
Stock Recommendations and Education
The Motley Fool provides recommendations and risk assessments for individual stocks, as well as educational resources on investing basics, market trends, and personal finance.
Community and Discussion
The Motley Fool provides forums where members can discuss investment ideas, ask questions, and share insights with other investors.
Stock Screeners and Tools
The Motley Fool allows users to screen stocks based on various financial metrics, helping investors identify potential investment opportunities. It also helps with tracking and managing investment portfolios.
How much does it cost?
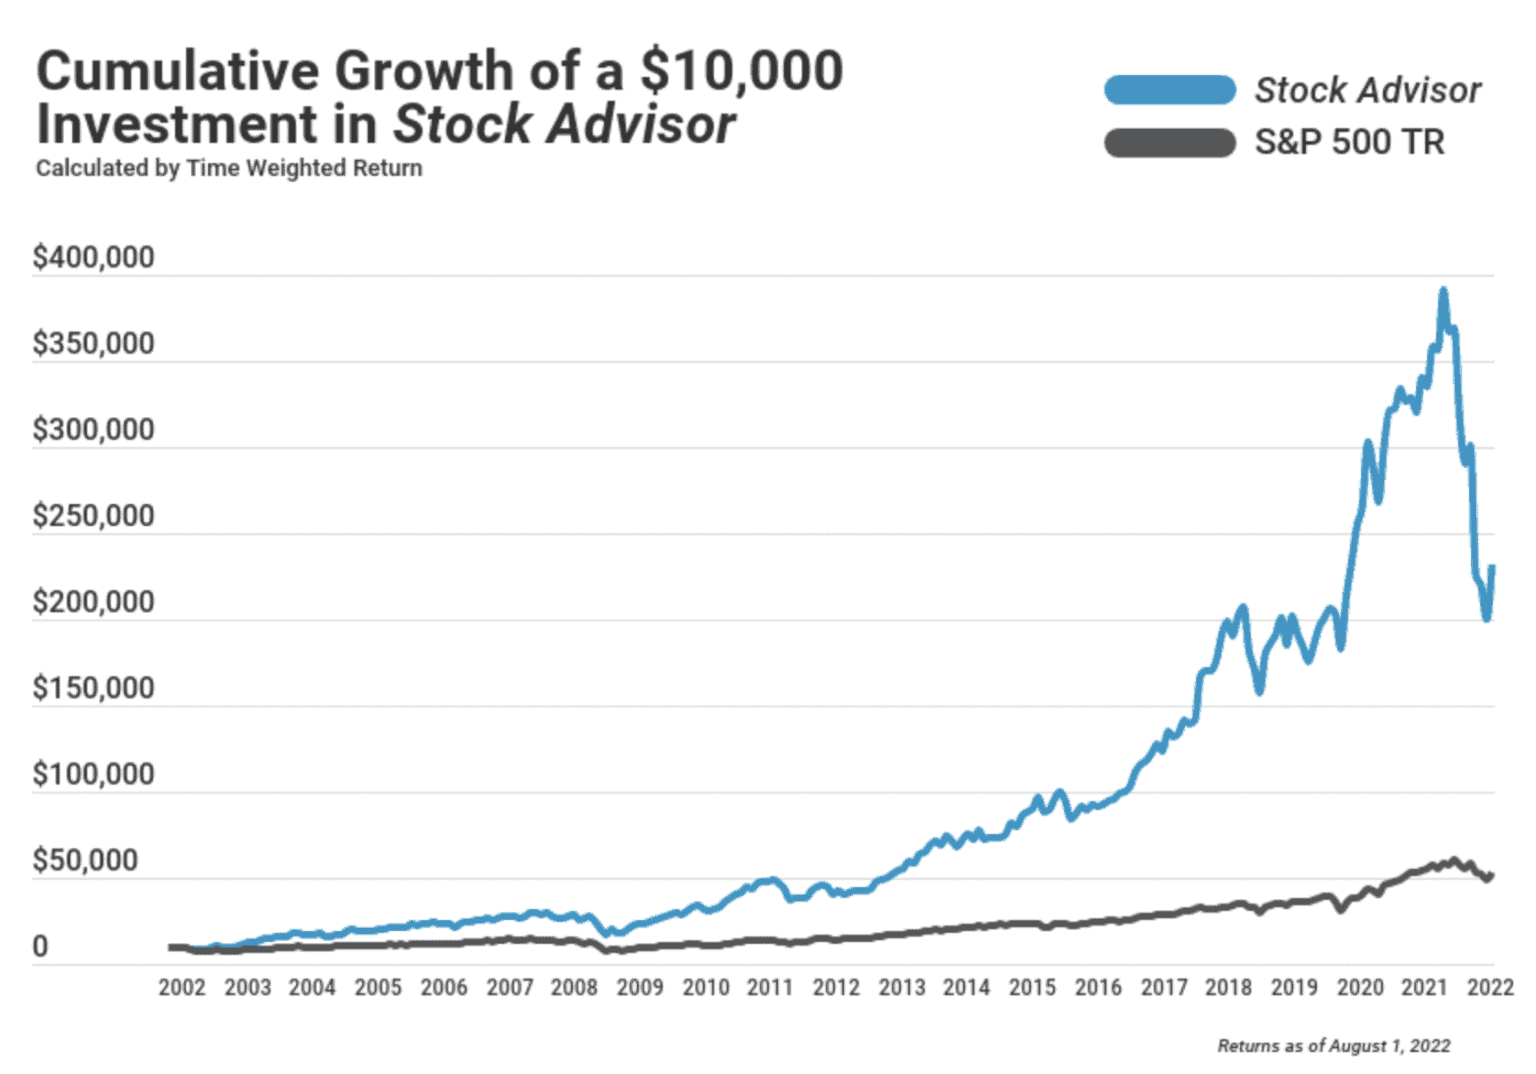
The Motley Fool has an extensive list of products that vary in cost. Their most popular product offerings include The Motley Fool Stock Advisor (their proprietary stock picking service) at $199/year, the Epic Bundle (for more advanced investors) at $499/year, and Rule Breakers (an investment advisory service focusing on growth stocks with high volatility) at $299/year.
See all of The Motley Fool’s products, services, and prices here.
Choosing the Right Tool
There are a few key questions you can ask yourself to determine which of these tools are the right fit.
What is your budget? Quickly eliminate any options that fall outside of your price range.
What are your needs? If you are a retail or individual investor, you will need a vastly different platform than if you are an institutional investor or are part of an enterprise organization. The lower-cost options on this list are unlikely to fit the needs of anyone beyond an individual investor.
How do you work? If team collaboration is a significant aspect of your workflow, make sure to choose a research tool that will enable you to effectively work with others and that will seamlessly integrate into your existing systems. If you normally focus on individual research, you can go with an option that is less collaboration-driven and more streamlined.
What are your goals? As outlined in this guide, some tools (like AlphaSense) are built to drive a complete, full-scale investment research strategy. Others focus more exclusively on stock valuation and comparison. Still others are built for specific individuals and goals. Choose a platform well-aligned with the things you want to accomplish.
Try AlphaSense For Free
The AlphaSense platform offers a comprehensive set of features so you never have to sacrifice one capability for another — you’ll have the tools, resources, and support you need to execute a full-scale stock and investment research strategy to drive results. With access to premium, proprietary, public, and private data and industry-leading AI capabilities, AlphaSense is your one stop shop for comprehensive, data-driven investment research.
If you’re ready to level up your research for smarter investing, you can start by exploring all that AlphaSense has to offer. Sign up for your free trial today.


